


























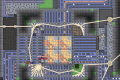

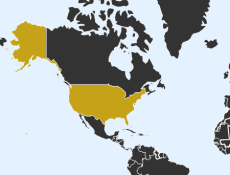
Small flashes appearing across a world map provide a visual representation of childbirth in Baby Map. The project illustrates how births are distributed among countries by animating simulated events based on demographic information. Each appearance of a highlighted country represents another modeled birth. Watching the map over time reveals considerable differences in the frequency of these events. Unlike a traditional game, the experience does not contain a winning condition, character controls, or tasks requiring immediate responses. Its purpose is to transform population statistics into a continuously developing visual pattern that can be understood through observation.


Baby Map
Advertisement
Advertisement







Small flashes appearing across a world map provide a visual representation of childbirth in Baby Map. The project illustrates how births are distributed among countries by animating simulated events based on demographic information. Each appearance of a highlighted country represents another modeled birth. Watching the map over time reveals considerable differences in the frequency of these events. Unlike a traditional game, the experience does not contain a winning condition, character controls, or tasks requiring immediate responses. Its purpose is to transform population statistics into a continuously developing visual pattern that can be understood through observation.
How the World Map Works
The map displays national boundaries and highlights countries as simulated births occur. Regions with larger numbers of annual births generally appear more frequently than countries where fewer children are born. The animation makes it possible to observe the rhythm of demographic activity without examining a large spreadsheet. It is important to understand that the displayed events are statistical representations. They are not verified reports arriving from individual hospitals or government registration offices at the exact moment of birth. The simulation communicates the scale and distribution of births rather than tracking identifiable families.
What Visitors Can Discover
Watching the map and its accompanying counts can introduce several useful demographic concepts:
- The unequal distribution of births across different countries.
- The relationship between population size and total births.
- Differences between absolute numbers and birth rates.
- The effect of population age structure on demographic activity.
- The continuing accumulation of simulated birth events.
- The geographical diversity of countries and regions.
- The limitations of statistical real-time visualizations.
A large number of flashes does not automatically mean that a country has the world’s highest fertility rate. Population size also influences the total number of children born. Comparing a large country with a much smaller one therefore requires distinguishing between total births and rates measured relative to population. The visualization can prompt these questions even though it is not intended to replace detailed demographic research.
Observing Global Population Patterns
Baby Map allows visitors to watch the simulation at their own pace. A brief session provides an impression of the distribution of births, while a longer observation makes recurring geographic patterns more apparent. There are no levels to unlock or challenges to complete. The changing map itself is the main attraction. By emphasizing the passage of time, the project offers a simple introduction to how population statistics describe events occurring throughout the world on an enormous collective scale.
Comments (0)


2026
